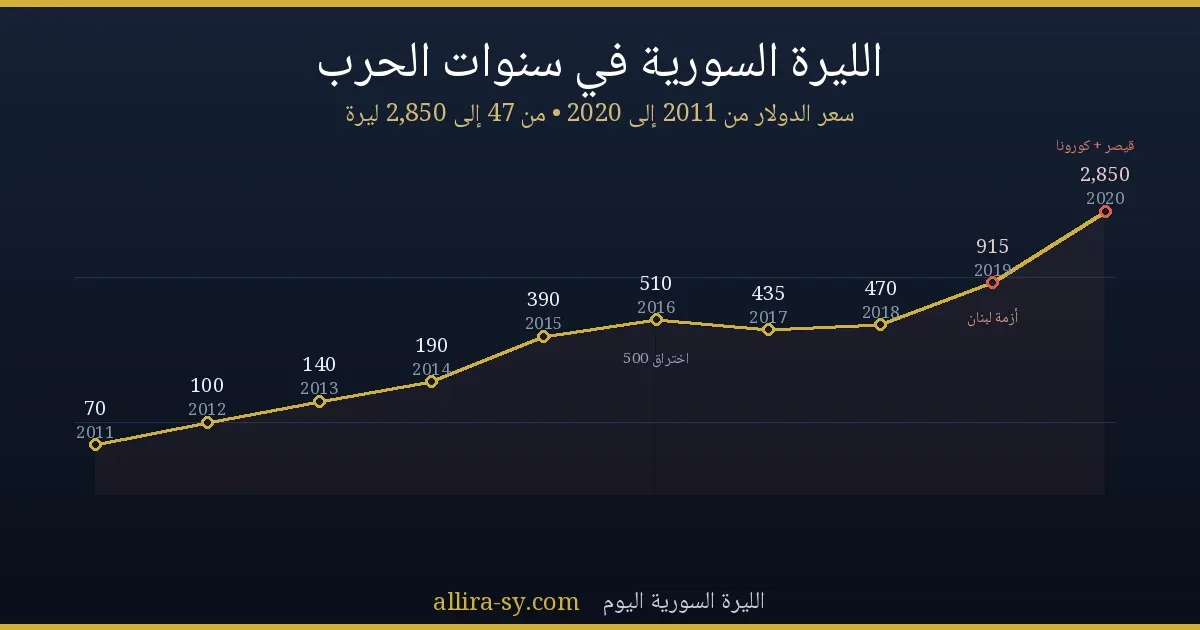
In March 2011 the dollar bought about 47 Syrian Pounds. Ten years later it had multiplied more than fiftyfold. This second part of our historical series documents the decade of collapse year by year. For the full picture from 1950 to 2026, see our complete reference on the history of the US Dollar in Syria. Figures are approximate and reflect the parallel-market rate, which became Syrians' real reference.
2011–2012: the first shock
With unrest and the first sanctions, the dollar broke 50 then 70 pounds during 2011 and ended 2012 near 100 — the first doubling in decades, driven by capital flight and collapsing exports and tourism.
2013–2014: the second doubling
Expanding battlefronts pushed the dollar to a peak near 300 in mid-2013 before central bank interventions pulled it back; 2014 closed around 190.
2015–2016: the 500 barrier
As reserves drained, the dollar passed 300 in 2015 and broke 500 in 2016, peaking near 650, before stabilizing at 435–500 in 2017–2018 as frontlines froze.
2019: Lebanon's crisis hits the pound
The blow came from outside: the collapse of Lebanon's banking sector, where billions in Syrian deposits were held. The dollar jumped from about 600 in early 2019 to over 900 by year-end.
2020: the Caesar Act and the 3,000 barrier
2020 was the decade's worst: Caesar sanctions took effect amid the pandemic and Lebanon's ongoing meltdown. The dollar broke 1,000 then 2,000, touching above 3,000 in June 2020 before closing the year near 2,850.
Year-by-year table (approx. market rate, year-end)
| Year | USD (old SYP) |
|---|---|
| 2011 | ~70 |
| 2012 | ~100 |
| 2013 | ~140 (peak ~300) |
| 2014 | ~190 |
| 2015 | ~390 |
| 2016 | ~510 (peak ~650) |
| 2017 | ~435 |
| 2018 | ~470 |
| 2019 | ~915 |
| 2020 | ~2,850 (peak ~3,100) |
And after 2020? The dollar didn't stop at 2,850 — see how it passed 15,000 pounds before the new currency was born, in the Syrian Pound from 2021 to 2026, and track the live USD rate today.